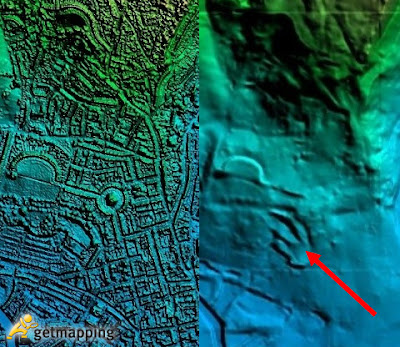
But there's more! Getmapping also produce Colour Infrared (CIR) and Elevation Models (DSM, DTM) (DSM pictured above) which are available as base layers in the 'Other Mapping' group in the Layer Control. These layers are a little different to normal aerial photography layers so let me explain what they are.
Colour Infrared (CIR)
Our aerial survey cameras collect four bands of information; red, green, blue and infrared. With normal photography we take the red, green and blue data and produce a true-colour aerial photograph. The infrared band isn't used in true-colour photography because humans can't see infrared light, but it is still a useful band to have. To show the infrared information we display infrared as red, green as red, and blue as green. This gives us a false-colour image.
In the images above we can compare aerial photography with CIR. We can see that the trees are a brighter red than the bowling green between the tennis courts, indicating that short, worn grass may not be as healthy as the trees. We can also use the CIR to analyse materials. The tennis courts at the bottom of the aerial photography image are green. Does this mean they're grass courts or green-painted tarmac? Well if we look at the CIR we can see that there is an extremely weak amount of red in the image so we could conclude that that court is tarmac painted green.
Digital Elevation Model (DSM and DTM)
The next dataset to show you is the Getmapping Elevation Model. This product is split into two seperate layers; the Digital Surface Model (DSM) and the Digital Terrain Model (DTM). These are two height layers that give you very different views of the earth.
The DSM is a representation of the ground, including all the buildings and vegetation. The DTM is the same data but with all the buildings and vegetation stripped away, leaving the bare earth. To make the elevations easier to see, we apply a range of colours and shading to the data. So blue is the lowest, moving up through green, orange, red and finally white as the highest. This can give you a very unique perspective on what is happening on the ground compared to aerial photography. For example, we can see from the image above that the dark shadow in the centre appears to be where the ground has been excavated and flattened. This, funnily enough, is the same location as the tennis courts in the CIR example!
So we'd encourage you to explore these layers, get accustomed to them, and see if you can use them for your work in interesting and new ways! If you have any questions, get in touch through the User Forum or in the comments section of this blog.


No comments:
Post a Comment