So to complement our recent Parish Online videos introducing the product and to help people understand the PSMA, we've released 8 new videos to show the key features within Parish Online.
We hope that they will assist in the free evaluations we give out and show what can be done in the online software.
There are a few ways you can enjoy these new video nuggets;
Enjoy!
Thursday, 17 November 2011
Friday, 11 November 2011
Understanding Parish Online and the PSMA
Recently we've had a few questions from people asking about the way Parish Online works with the PSMA. Now the world of digital mapping is full of acronyms and to the uninitiated it can get confusing.
So to help with the PSMA, here's a short video to explain it.
So to help with the PSMA, here's a short video to explain it.
Friday, 30 September 2011
September: the month of conferences!
As I write this I'm on a Lufthansa A320 heading back from Nuremberg feeling absolutely exhausted. September has been a busy month for us with the majority of the major conferences taking place around this time of the year. Here's what I've been up to!
 Addresses, architecture and answers
The month started with a trip to the swanky new Ordnance Survey HQ in Southampton. The OS Insight event that was being held there is where the OS showcase their new products and get feedback from the reseller and partner community (that's us!). At this event they showed us a preview of what everyone now knows as AddressBase, the new addressing product that supersedes the NLPG, AL2 and PAF.
 This event answered many of the questions surrounding addressing so was a very useful event. With this insider information and test data our team of developers got started on integrating the new product into our District Online and Parish Online product. We also took the opportunity to add a number of new filters that will greatly assist our Local Authority customers. We expect this to be rolled out in the next week or so meaning that our Web GIS users remain up-to-date with their PSMA datasets.
Satellites, sensors and science
The following week saw me down in Bournemouth for the Remote Sensing & Photogrammetry Society (RSPSoc) Annual Conference. I've been a member of this society for a good few years now and the annual conference is a great event full of brilliant scientists and professionals delivering interesting and thought-provoking presentations. The highlight for me was Dr Robert Bindschadler's (NASA) talk on the use of Remote Sensing in analysis of the Antarctic. It was a great insight into the work he has done over the last 25 years. Now it doesn't really affect my day-to-day job as there isn't really a need for Web Mapping services on the most Southern part of this Earth (yet!), but it's great to see what others are doing in my field of interest; namely Remote Sensing and GIS.
 As for the rest of the event, many new interesting leads and connections were made that will affect how Getmapping's products and services will form in the future... all very exciting stuff! I would highly recommend becoming a member of RSPSoc as it gives you the opportunity to interact with such an amazing group of people. My only fear for next years conference (in Greenwich) is I'll inevitably get dragged into taking part in the Ceilidh. Spoons at the ready! (inside joke, sorry!).
 Geo-geeks, Twitter and Surfing
Before I knew it anther week was over and I found myself (geographically, not philosophically) in Nottingham for another big event, the Association of Geographic Information (AGI) GeoCommunity annual conference. This is the largest collection of GI professionals in the UK you're ever likely to find. It was great to catch up with friends, colleagues and also find new possibilities and areas that our Web GIS products could be used.
 This year was interesting due to the ever-increasing use of twitter during the conference. #geocom was heavily used and I found myself drawn in to the silent discussion undercurrent over the twittersphere whilst presentations were taking place (@GetmappingChris). Some were serious points, some were questions and some were light-hearted jokes, but it was all an added media experience I enjoyed. The biggest twitter uproar was the flagrant use of Google Maps during an Ordnance Survey presentation; something the die-hard cartographers were shocked at (including me I might add)!
 So my highlight (apart from the notebook full of leads and techy ideas) was Kimberly Kowal's (Lead Curator for the British Library) presentation, a cartographic tour de force of stunning visuals, historic mapping and geeky nuggets of knowledge. My lowlight, well, there are two. The first being that my house is now FULL of conference paraphernalia; notebooks, magazines, flyers, pens, hemp bags, postcards and print outs! The second, my shock and horror as I realise that whilst talking to someone on my right at dinner, my (rather delicious) starter had been whisked away without having the chance to finish it! The only consolation to this... seeing my colleague fail spectacularly on the surf machine at the evening party! Fortunately he remained unharmed and is currently busy coding features in District Online!
Parishes, PSMA and the Ordnance Survey
As I headed to Heathrow for the next part of my September, my colleagues were holding a Parish Online event in Hook. This was to generate interest in our Parish mapping tool for Clerks and Councillors to help them manage their Parish more easily.
 With our 30 day free trial still running we're seeing new Parishes sign up every day. This is brilliant news as we really believe in the power of mapping to assist in the Parish Clerk's work.
With the PSMA allowing Parishes a licence for OS maps, Parish Online is established as an essential tool for viewing and using the mapping data without needing professional GIS software. We're also happy to hear that the Ordnance Survey see Parish Online as a great way for Public Sector bodies to use mapping in an intelligent and easy way. I will have more news on Parish Online in the weeks to come as we continue to improve it based on feedback from our customers and new leads from the previous conferences.
Bratwurst, weißbeer and sunshine
Now by the title to this you would assume I spent the week in Germany relaxing outside with a beer and fine Bavarian cuisine? Well not quite! I was at Intergeo, one of the largest exhibitions I've ever been to! We had a stand and were able to showcase our Web GIS (District Online and Parish Online) as well as our European aerial survey operations and data streaming services. We also had the chance to catch up with companies that we've been working with recently, such as Cyclomedia. Our collaboration to add Cyclomedia street-level imagery into District Online has been a great success in its current beta-guise.
 As for Germany as a whole, I love it and have spent quite a lot of time there in the past so it was nice to reacquaint myself with fantastic food and drink and the occasional bit of sunshine (when I managed to escape the conference centre!). At least the great weather over Europe has been keeping our Flight Operations department busy!
 So that was my September! October looks to be busy too with the PSMA roadshow that we'll be taking part in. Hopefully I'll have time in between to clear up my house!
Thanks for reading and look out for me and my colleagues at the London, Nottingham, Cardiff and Manchester shows!

The month started with a trip to the swanky new Ordnance Survey HQ in Southampton. The OS Insight event that was being held there is where the OS showcase their new products and get feedback from the reseller and partner community (that's us!). At this event they showed us a preview of what everyone now knows as AddressBase, the new addressing product that supersedes the NLPG, AL2 and PAF.

Satellites, sensors and science
The following week saw me down in Bournemouth for the Remote Sensing & Photogrammetry Society (RSPSoc) Annual Conference. I've been a member of this society for a good few years now and the annual conference is a great event full of brilliant scientists and professionals delivering interesting and thought-provoking presentations. The highlight for me was Dr Robert Bindschadler's (NASA) talk on the use of Remote Sensing in analysis of the Antarctic. It was a great insight into the work he has done over the last 25 years. Now it doesn't really affect my day-to-day job as there isn't really a need for Web Mapping services on the most Southern part of this Earth (yet!), but it's great to see what others are doing in my field of interest; namely Remote Sensing and GIS.


Before I knew it anther week was over and I found myself (geographically, not philosophically) in Nottingham for another big event, the Association of Geographic Information (AGI) GeoCommunity annual conference. This is the largest collection of GI professionals in the UK you're ever likely to find. It was great to catch up with friends, colleagues and also find new possibilities and areas that our Web GIS products could be used.


Parishes, PSMA and the Ordnance Survey
As I headed to Heathrow for the next part of my September, my colleagues were holding a Parish Online event in Hook. This was to generate interest in our Parish mapping tool for Clerks and Councillors to help them manage their Parish more easily.

With the PSMA allowing Parishes a licence for OS maps, Parish Online is established as an essential tool for viewing and using the mapping data without needing professional GIS software. We're also happy to hear that the Ordnance Survey see Parish Online as a great way for Public Sector bodies to use mapping in an intelligent and easy way. I will have more news on Parish Online in the weeks to come as we continue to improve it based on feedback from our customers and new leads from the previous conferences.
Bratwurst, weißbeer and sunshine
Now by the title to this you would assume I spent the week in Germany relaxing outside with a beer and fine Bavarian cuisine? Well not quite! I was at Intergeo, one of the largest exhibitions I've ever been to! We had a stand and were able to showcase our Web GIS (District Online and Parish Online) as well as our European aerial survey operations and data streaming services. We also had the chance to catch up with companies that we've been working with recently, such as Cyclomedia. Our collaboration to add Cyclomedia street-level imagery into District Online has been a great success in its current beta-guise.
 |


Thanks for reading and look out for me and my colleagues at the London, Nottingham, Cardiff and Manchester shows!
Monday, 8 August 2011
What's New in District Online (Release 3.3)
We're always keen to adopt new technologies or data that help our customers save money and become more productive through using GIS. This latest release of our Web GIS is a simple one; we've added a feed of Cyclomedia Street-level imagery.
 You may be familiar with this type of information if you've ever used Google Street View. It allows you to see what is on the ground in a 360 degree interactive view. This allows people using District Online (our Web GIS for Local Authorities) to inspect sites without actually going there.
 This data also has large cost-savings implications for the Local Authority as staff can use the imagery to save them visiting sites in person. This saves time and money as well as having a positive impact on the environment by reducing the amount of travelling.
This survey was carried out in April by two Cyclomedia cars who photographed Bath's streets, as well as some of the pedestrianised areas. The benefit of having structured surveys is that Council employees know exactly when the imagery was taken and can therefore rely on it for their work.
 This latest update is only available for our Bath & North East Somerset users at present as we want to trial how it is used and how we can improve it in the future. We'll be implementing overlays of GIS data and 3D measurement tools that will make life even easier.


This survey was carried out in April by two Cyclomedia cars who photographed Bath's streets, as well as some of the pedestrianised areas. The benefit of having structured surveys is that Council employees know exactly when the imagery was taken and can therefore rely on it for their work.

Friday, 29 July 2011
GIS Infrastructure for Local Authorities: the Getmapping Integrated Solution
Map data is not just for the GIS department. In the Geographic Information industry we've known this for a long time now. We are always looking for ways to more efficiently share our data; whether it be high resolution aerial photography or the locations of traffic incidents. It's what we do.
However, it's not always that easy. We've got to think about the data version, security, projection, accuracy, ownership, copyright, maintenance, file size and format. We've then got to decide how to deliver that data to someone, taking into account what systems they use, the formats they can use and how they intend on using it. Ok, you get the picture, it's a minefield!
 So what can we do to make this easier for ourselves? Well the first step is trusting the tools you use. A GIS Infrastructure is needed that allows you and your colleagues to store, protect, manipulate and share your data in a sensible and efficient way. At Getmapping, we've created an infrastructure that we believe covers this, but we've taken it a lot further to help tackle the problems that GIS teams in Local Authorities face in the current economic climate of doing more for less. It's called the Getmapping Integrated Solution. Let me give you a quick summary of what it does, and why you should consider it for your Local Authority.
Firstly, it is extremely good at data sharing, but responsible data sharing. The ISM module is a Spatial Data Warehouse that let's you manage your data with MapInfo, ArcGIS or CAD (or all of them at the same time), and then publish the data through controlled Web Feature Services (WFS). By using Web Feature Services, you know that your recipient is going to be viewing the most up-to-date data available, instantly over the Internet. No more DVDs of out-of-date data getting lost in the post!
 The second part of this infrastructure is District Online, a web-GIS tool that lets your colleagues view GIS data in seconds. District Online also has powerful search, print, measurement, and analysis tools as well as 24/7 login access from anywhere in the World. It stacks up to be a pretty important tool for a Local Authority by giving more people more access to this geographic data that plays a large part in their day-to-day work.
 The Getmapping Integrated Solution has many other modules that make up this powerful infrastructure but for this blog i'll just cover one more, our Map Streaming & Data Hosting Service. This uses OGC-compliant web feeds (WMS/WFS) to stream aerial photography, Ordnance Survey mapping and other 3rd party data directly to your users. This means all users of MapInfo, ArcGIS, CAD products or District Online can get access to national coverages of mapping data without needing to contact the GIS team. It's very fast and performs well over broadband or mobile connections. The Data Hosting element of this module means that the Local Authority can take advantage of all the archive mapping they have stored in cupboards by getting Getmapping to convert them into their own WMS feeds. Again, this gives more people access to this interesting data.
 The Getmapping Integrated Solution is working very well at Bath & North East Somerset as you'll be able to read in this case study we recently carried out. If you'd like more information or would like me to meet you to discuss it please get in touch in any of these ways; webgis@getmapping.com, twitter @CMewseGM, add me on LinkedIn, or contact Getmapping's sales team on 01252845444 and they'll put you through to me (Chris Mewse).
Let's make data sharing easier with this new product that adopts modern technologies to solve these problems!
However, it's not always that easy. We've got to think about the data version, security, projection, accuracy, ownership, copyright, maintenance, file size and format. We've then got to decide how to deliver that data to someone, taking into account what systems they use, the formats they can use and how they intend on using it. Ok, you get the picture, it's a minefield!

Firstly, it is extremely good at data sharing, but responsible data sharing. The ISM module is a Spatial Data Warehouse that let's you manage your data with MapInfo, ArcGIS or CAD (or all of them at the same time), and then publish the data through controlled Web Feature Services (WFS). By using Web Feature Services, you know that your recipient is going to be viewing the most up-to-date data available, instantly over the Internet. No more DVDs of out-of-date data getting lost in the post!


Let's make data sharing easier with this new product that adopts modern technologies to solve these problems!
Monday, 4 July 2011
Milton Keynes parishes join Parish Online
We are pleased to announce that all 47 parishes in Milton Keynes have joined Parish Online.
 We are seeing more and more that Parish Clerks, Councillors and in this case, the Local Authority, realising the power of this online mapping tool. It's simplicity, wealth of mapping information and easy-to-use GIS tools prove indispensable for those managing the Parish Councils in the UK.
With increasing emphasis by the UK coalition government on promoting Localism, the low-cost Parish Online service ticks all the boxes by automatically feeding important local and national mapping information to the Parish administrators.
 The parishes in Milton Keynes can now access information such as; Tree Preservation Orders, Listed Building locations and conservation areas. This mapping and Local Authority information all helps the Parish to understand their environment and make more informed decisions at the most local level.
We'd like to thanks MK Council and all the enthusiastic parish administrators for joining the Parish Online community.
The Parish Online 30 day free trial is still available to individual parishes. It can also be purchased by the Local Authority as a group. Please contact us to find out how to do this.

With increasing emphasis by the UK coalition government on promoting Localism, the low-cost Parish Online service ticks all the boxes by automatically feeding important local and national mapping information to the Parish administrators.

We'd like to thanks MK Council and all the enthusiastic parish administrators for joining the Parish Online community.
The Parish Online 30 day free trial is still available to individual parishes. It can also be purchased by the Local Authority as a group. Please contact us to find out how to do this.
Monday, 20 June 2011
What's New in District Online (Release 3.2)
Since our last revision of District Online in March we've been working hard to bring our users some more functionality.
 Without waffling on I'll get straight down to what we've done;
The first thing that is very important to the day-to-day use of District Online is increasing the frequency of our NLPG updates. We now update these on a weekly basis. Our updates are received from GeoPlace LLP on a Monday so that's the day the database gets updated. This keeps District Online users more in tune with the LLPG datasets that may be used locally.
To complement the weekly updates for NLPG, we've also included some new functionality in the NLPG Search tool. Users can now search by UPRN (Unique Property Reference Number) and USRN (Unique Street Reference Number). This should make District Online a lot easier to use in planning departments, for example.
The NLPG tool also has a new feature that allows you to include historic addresses. So now, by default only the current addresses will show and you have to tick a box to have the historic addresses included.
You'll also notice that the NLPG points now appear at 1:2500 without labels instead of 1:1250 scale. This is something that was requested by one of our customers. We thought it was a great idea so have applied it to all our Web GIS accounts.
 The next new feature is in the Print tool. We've included an 'output to PNG' option which means users can embed mapping in other documents more easily than with just the PDF output. A PNG file is the same as a JPG image file and is supported by many pieces of software, such as Microsft Word, PowerPoint or Paint. You'll notice that the PNG export doesn't include a border which means you won't need to crop the image to make it fit and look right in other documents.

The final new feature in this update is the Circle tool in the Scratchpad. This allows you to create a circular polygon around a point on the map. You can specify the size of the circle in metres. Circle objects created with this tool work in exactly the same was as other objects, so you'll be able to use it with the Data Extraction Tool to export text information from other layers. I may have gone a bit overboard with this new feature in the image above!
Well, that's all for now! We're already working on our 3.3 release and i'll be sure to keep you informed with other news and info from the Web GIS team soon!

The first thing that is very important to the day-to-day use of District Online is increasing the frequency of our NLPG updates. We now update these on a weekly basis. Our updates are received from GeoPlace LLP on a Monday so that's the day the database gets updated. This keeps District Online users more in tune with the LLPG datasets that may be used locally.
To complement the weekly updates for NLPG, we've also included some new functionality in the NLPG Search tool. Users can now search by UPRN (Unique Property Reference Number) and USRN (Unique Street Reference Number). This should make District Online a lot easier to use in planning departments, for example.
The NLPG tool also has a new feature that allows you to include historic addresses. So now, by default only the current addresses will show and you have to tick a box to have the historic addresses included.
You'll also notice that the NLPG points now appear at 1:2500 without labels instead of 1:1250 scale. This is something that was requested by one of our customers. We thought it was a great idea so have applied it to all our Web GIS accounts.


The final new feature in this update is the Circle tool in the Scratchpad. This allows you to create a circular polygon around a point on the map. You can specify the size of the circle in metres. Circle objects created with this tool work in exactly the same was as other objects, so you'll be able to use it with the Data Extraction Tool to export text information from other layers. I may have gone a bit overboard with this new feature in the image above!
Well, that's all for now! We're already working on our 3.3 release and i'll be sure to keep you informed with other news and info from the Web GIS team soon!
Monday, 6 June 2011
Winchester City Council releases Planning Maps website powered by Getmapping
Winchester City Council have today launched a new webpage that gives residents 24/7 access to an online tool to create high-quality planning maps.
 This new service allows residents and businesses to create map extracts to accompany planning and building control applications. The service is based on Ordnance Survey MasterMap and Getmapping's highly detailed national aerial photography coverage.
This new site has major advantages for the residents of Winchester City Council as they now have a trusted online resource to buy their maps direct from the website without needing to make trips to the Council offices. Of course, residents can still visit the offices and use their suite of computers to produce their planning application map on the web.
This new services also has benefits for the Council itself. Enquires by email, phone or in-person regarding planning application maps can now be referred to this website for a quick and easy way to produce high-quality, consistent maps. This makes the drop-in centre more efficient and thus offers a better service to their public.
To access the new site, click on this link; Winchester City Council: Online Planning Maps and click on the link at the bottom of the page.
Getmapping can create online planning map services for Local Authorities at no cost and in a very short time. The Winchester City Council site was live within a week. For more information, contact myself (Chris Mewse) on email or twitter (CMewseGM).
Friday, 20 May 2011
Parish Online joins the Getmapping Web GIS family
Firstly, we have a new online ordering system that allows new Parish Councils to sign up for a free 30 day evaluation of Parish Online. After the trial period is up, there is an option to pay the low annual subscription fee and they'll be able to use Parish Online for all their Parish responsibilities.
We're really happy with this and hope it brings more Parishes into this mapping community.
These new Parish Online users will be able to log in using the Web GIS Portal and consequently have access to the new tools that are available in the new system, which brings me onto the next new update....
New Parish Online users will be presented with a new mapping interface. It hasn't dramatically changed, but is the result of the improvements we've been making to our other product, District Online. Let's run down the new features;
- A new layer control. This organises the map layers more neatly and can expand and contract to incorporate new layers. It also pops out from the left-hand side to help when you're choosing layers.
- A measurement tool. This tool allows you to measure points, lines and areas. You will find it under the Tools menu bar.
- Map View Parameters. This is a simple tool that displays coordinates for the edges of the map view. It also displays coordinates for the centre of the map window. This is also under the Tools menu.
- Legend. This is under the Map menu and shows you the layers that you have visible.
- Data Extraction tool. This allows you to extract information about the mapping data. For example I could extract a list of addresses from a particular road. You can extract information from any layer and export it to a CSV file (which can be used in Microsoft Excel or OpenOffice). Details on how to use it are in the Help files once you've logged in.
- Scratchpad tool. This is a new layer that can be used to annotate the map. Using this layer for temporary annotations means it doesn't get mixed up with your asset information in your Parish layers.
I'm sure these new tools will become very useful to our Parish Online users.
So what else is new?! Well, new Parish Online users are no longer restricted to what Ordnance Survey data they can see. The new PSMA licence agreement means our Parish customers are now able to view Ordnance Survey mapping for the whole of England, Scotland and Wales. This also includes the new Ordnance Survey OpenData layers so we were more than happy to add these into Parish Online. This is great news for our new users.
We've also secured an agreement that lets us add in mapping layers from Natural England. So now, all new Parish Online customers will be able to see a national coverage of this useful data. Here are the layers;
- Areas of Outstanding Natural Beauty (AONB)
- Countryside Rights of Ways (CRoWs)
- National Park boundaries
- Sites of Special Scientific Interest (SSSIs)
- Ancient Woodlands
- RAMSAR Sites, and,
- Environmentally Sensitive Areas.

Historic Woodland from Natural England. (Copyright Getmapping & Natural England)
We hope that these additional layers and all the updates i've mentioned make Parish Online a lot more useful for day-to-day Parish tasks.
For existing Parish Online users we will be migrating accounts over to the new system in the next few weeks. We'll notify you when your account has been updated and you can then use the new Web GIS Portal.
If you are a Parish Clerk or Councillor, give it a go! You've got nothing to lose, and we're sure you'll love it! Use this Parish Online Ordering System to get your account.
Please let me know what you think of the updates by getting in touch with myself (Chris Mewse) using the Comments below or visit our Parish Online Community group on LinkedIn!
Friday, 8 April 2011
Understanding the Colour Infrared and Elevation Layers
By now, users of our Web GIS will be familiar with the aerial photography and Ordnance Survey base layers available in the application. They give context to the GIS information on the map, and also provide an insight to what the built environment is like.
 But there's more! Getmapping also produce Colour Infrared (CIR) and Elevation Models (DSM, DTM) (DSM pictured above) which are available as base layers in the 'Other Mapping' group in the Layer Control. These layers are a little different to normal aerial photography layers so let me explain what they are.
Infrared is emitted by the sun and reflected by the chlorophyll in vegetation (if you remember your school science classes!). The amount of infrared reflected can tell us whether vegetation is healthy or not, or even what type of vegetation you are looking at.
 In the images above we can compare aerial photography with CIR. We can see that the trees are a brighter red than the bowling green between the tennis courts, indicating that short, worn grass may not be as healthy as the trees. We can also use the CIR to analyse materials. The tennis courts at the bottom of the aerial photography image are green. Does this mean they're grass courts or green-painted tarmac? Well if we look at the CIR we can see that there is an extremely weak amount of red in the image so we could conclude that that court is tarmac painted green.
Digital Elevation Model (DSM and DTM)
The next dataset to show you is the Getmapping Elevation Model. This product is split into two seperate layers; the Digital Surface Model (DSM) and the Digital Terrain Model (DTM). These are two height layers that give you very different views of the earth.
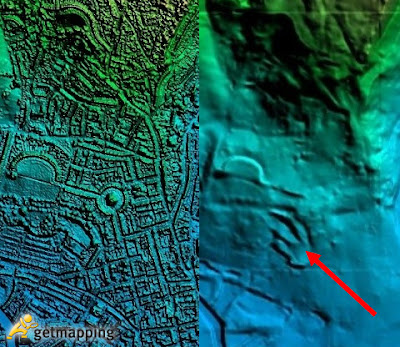 The DSM is a representation of the ground, including all the buildings and vegetation. The DTM is the same data but with all the buildings and vegetation stripped away, leaving the bare earth. To make the elevations easier to see, we apply a range of colours and shading to the data. So blue is the lowest, moving up through green, orange, red and finally white as the highest. This can give you a very unique perspective on what is happening on the ground compared to aerial photography. For example, we can see from the image above that the dark shadow in the centre appears to be where the ground has been excavated and flattened. This, funnily enough, is the same location as the tennis courts in the CIR example!
So we'd encourage you to explore these layers, get accustomed to them, and see if you can use them for your work in interesting and new ways! If you have any questions, get in touch through the User Forum or in the comments section of this blog.

Colour Infrared (CIR)
Our aerial survey cameras collect four bands of information; red, green, blue and infrared. With normal photography we take the red, green and blue data and produce a true-colour aerial photograph. The infrared band isn't used in true-colour photography because humans can't see infrared light, but it is still a useful band to have. To show the infrared information we display infrared as red, green as red, and blue as green. This gives us a false-colour image.

Digital Elevation Model (DSM and DTM)
The next dataset to show you is the Getmapping Elevation Model. This product is split into two seperate layers; the Digital Surface Model (DSM) and the Digital Terrain Model (DTM). These are two height layers that give you very different views of the earth.

So we'd encourage you to explore these layers, get accustomed to them, and see if you can use them for your work in interesting and new ways! If you have any questions, get in touch through the User Forum or in the comments section of this blog.
Wednesday, 30 March 2011
What's New in District Online (Release 3.1)
One of the advantages of using a fully hosted Web GIS is that we can deploy new versions of the application quickly and with minimal disruption to the user. Gone are the days of waiting years for new updates to be released and then having to install them on every single computer at a cost of thousands!
With District Online, as soon as we make changes to the application, you can see them immediately. This means we regularly make updates and apply new functionality without disrupting your work.
So the end of March brings one of these updates, and while the mapping interface itself may not appear to have changed much, we have made some fundamental changes in the administration panels and the core back-end code. Let's take a look at all the changes we've made.
There are a few things in District Online mapping interface that you will notice. Firstly, the left panel where the options to choose base layers (such as Aerial Photography and Ordnance Survey mapping) can now be undocked to present an easier view of the base layers, as well as the GIS layers such as Tree Preservation Orders or Flood Map zones.
 What's more, you can now expand and collapse these groups of layers to give you a clearer view of the GIS information that is available to you.
For staff at Bath & North East Somerset Council you will also notice that there are many more layers to choose from. This is an ongoing programme to give more staff access to more information, all through the simple District Online interface. So if you notice that your department's data is not in District Online yet, make arrangements with your GIS team and you can benefit from sharing your data with your colleagues.
Now I won't go into detail on the administration panel updates because the majority of people won't have access to them, but the key functionality changes allow the administrator to create these new groups of GIS layers and assign them to users. These layers can now be assigned custom colours, symbols and labels based on their attributes and data types.
So, as ever, have a look at the updated District Online and hopefully you'll be using it every day!
Any comments or suggestions, drop us a note in the User Forum (currently in need of some input!) and one of our team will reply.
With District Online, as soon as we make changes to the application, you can see them immediately. This means we regularly make updates and apply new functionality without disrupting your work.
So the end of March brings one of these updates, and while the mapping interface itself may not appear to have changed much, we have made some fundamental changes in the administration panels and the core back-end code. Let's take a look at all the changes we've made.
There are a few things in District Online mapping interface that you will notice. Firstly, the left panel where the options to choose base layers (such as Aerial Photography and Ordnance Survey mapping) can now be undocked to present an easier view of the base layers, as well as the GIS layers such as Tree Preservation Orders or Flood Map zones.
For staff at Bath & North East Somerset Council you will also notice that there are many more layers to choose from. This is an ongoing programme to give more staff access to more information, all through the simple District Online interface. So if you notice that your department's data is not in District Online yet, make arrangements with your GIS team and you can benefit from sharing your data with your colleagues.
Now I won't go into detail on the administration panel updates because the majority of people won't have access to them, but the key functionality changes allow the administrator to create these new groups of GIS layers and assign them to users. These layers can now be assigned custom colours, symbols and labels based on their attributes and data types.
So, as ever, have a look at the updated District Online and hopefully you'll be using it every day!
Any comments or suggestions, drop us a note in the User Forum (currently in need of some input!) and one of our team will reply.
Friday, 25 March 2011
An easier way to log into the Web GIS using Google Chrome
We have just published a new Google Chrome Web App that allows users to quickly gain access to the Web GIS. Click here to go to the Web Store (if you're using Chrome).
By installing the Web App in your Chrome browser you will have a large link that will take you to the homepage. If you are already logged in then it will take you straight to the mapping.
Although Google Chrome only accounts for approx 10% of traffic to our Web GIS, we'd like to promote the use of the newer modern browsers such as Internet Explorer 8 and 9, Firefox, Safari and Chrome. These new browsers support modern webpage formatting and allow us to implement clever functionality that is not possible in browsers like Internet Explorer 6 which is 10 years old this year!
So if you're using Chrome, give it a go!
Wednesday, 23 March 2011
Redesigning Local Services at the Barbican
Today we have a stand at the "Redesigning Local Services" event at the Barbican Centre in London. We'll be demonstrating our District Online and Parish Online web applications as well as showing some of the new mapping products we supply; obliques, 3D building models and height data.

The event is being held in the large greenhouse in the Barbican exhibition centre. I'm surrounded by palm trees, tropical birds and there are streams of koi carp. Certainly not the most normal venue but cool nonetheless!
If you're heading to the event come and see us, and if not get in touch!

The event is being held in the large greenhouse in the Barbican exhibition centre. I'm surrounded by palm trees, tropical birds and there are streams of koi carp. Certainly not the most normal venue but cool nonetheless!
If you're heading to the event come and see us, and if not get in touch!
Wednesday, 9 March 2011
New Blog for Getmapping's New Product
As I write this we are in the process of launching our new Web GIS Portal. It's only been 3 months since we launched the first page design, and indeed the Web GIS itself, but a lot of progress has been made since then.
 This new design aims to keep the users of our Web GIS well informed of new developments and examples of how the product is being used. This Blog will include posts from myself (Chris Mewse) as well as other members of the Web GIS team. We may also bring in guest bloggers from our customers or partners of Getmapping.
We urge you to register for the User Forum as we hope this will become the primary location for posting suggestions, issues/bugs and tips that you'd like to share with other users.
Our Tutorials page will be populated with useful videos from all aspects of our Web GIS, spatial data warehouse and Map Streaming Service. This page will be useful for newcomers to the product, or veterans looking for tips on using new features.
Please explore the new content on the site and don't forget to report back if you spot things that are missing or just plain wrong!
Thanks, Chris
Subscribe to:
Posts (Atom)